ENCODED TERRAINS
OF CHANGE
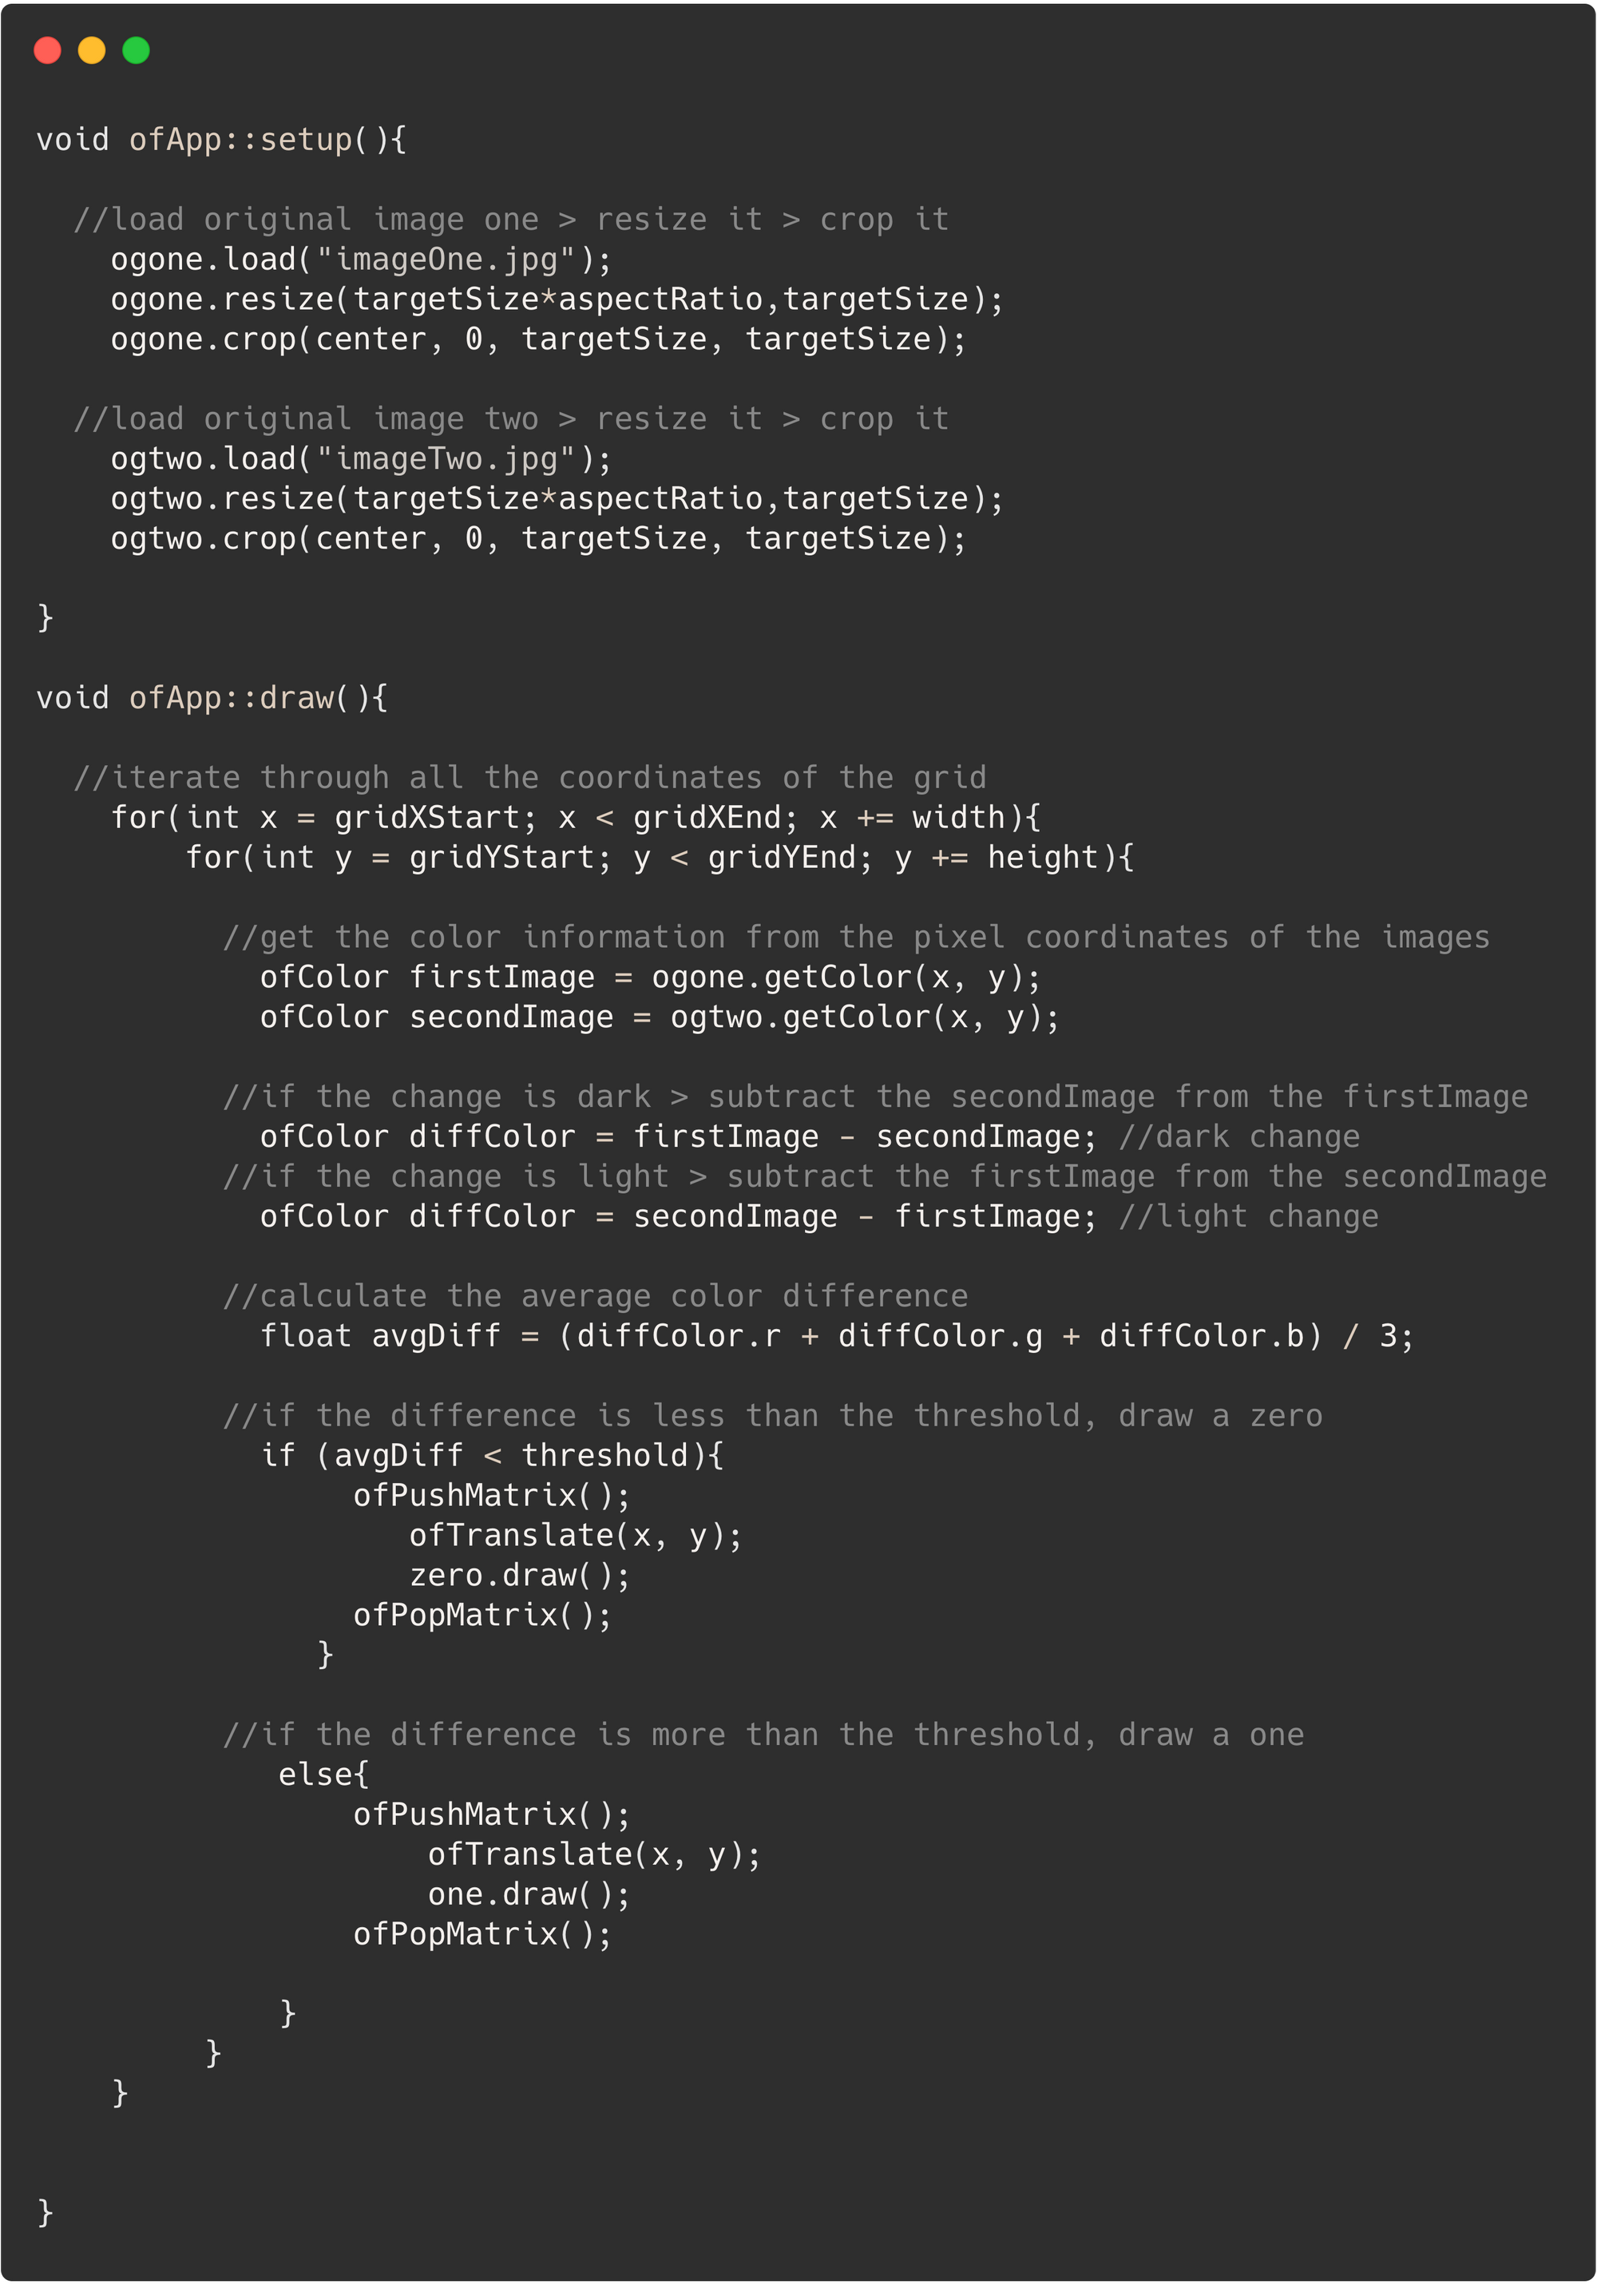
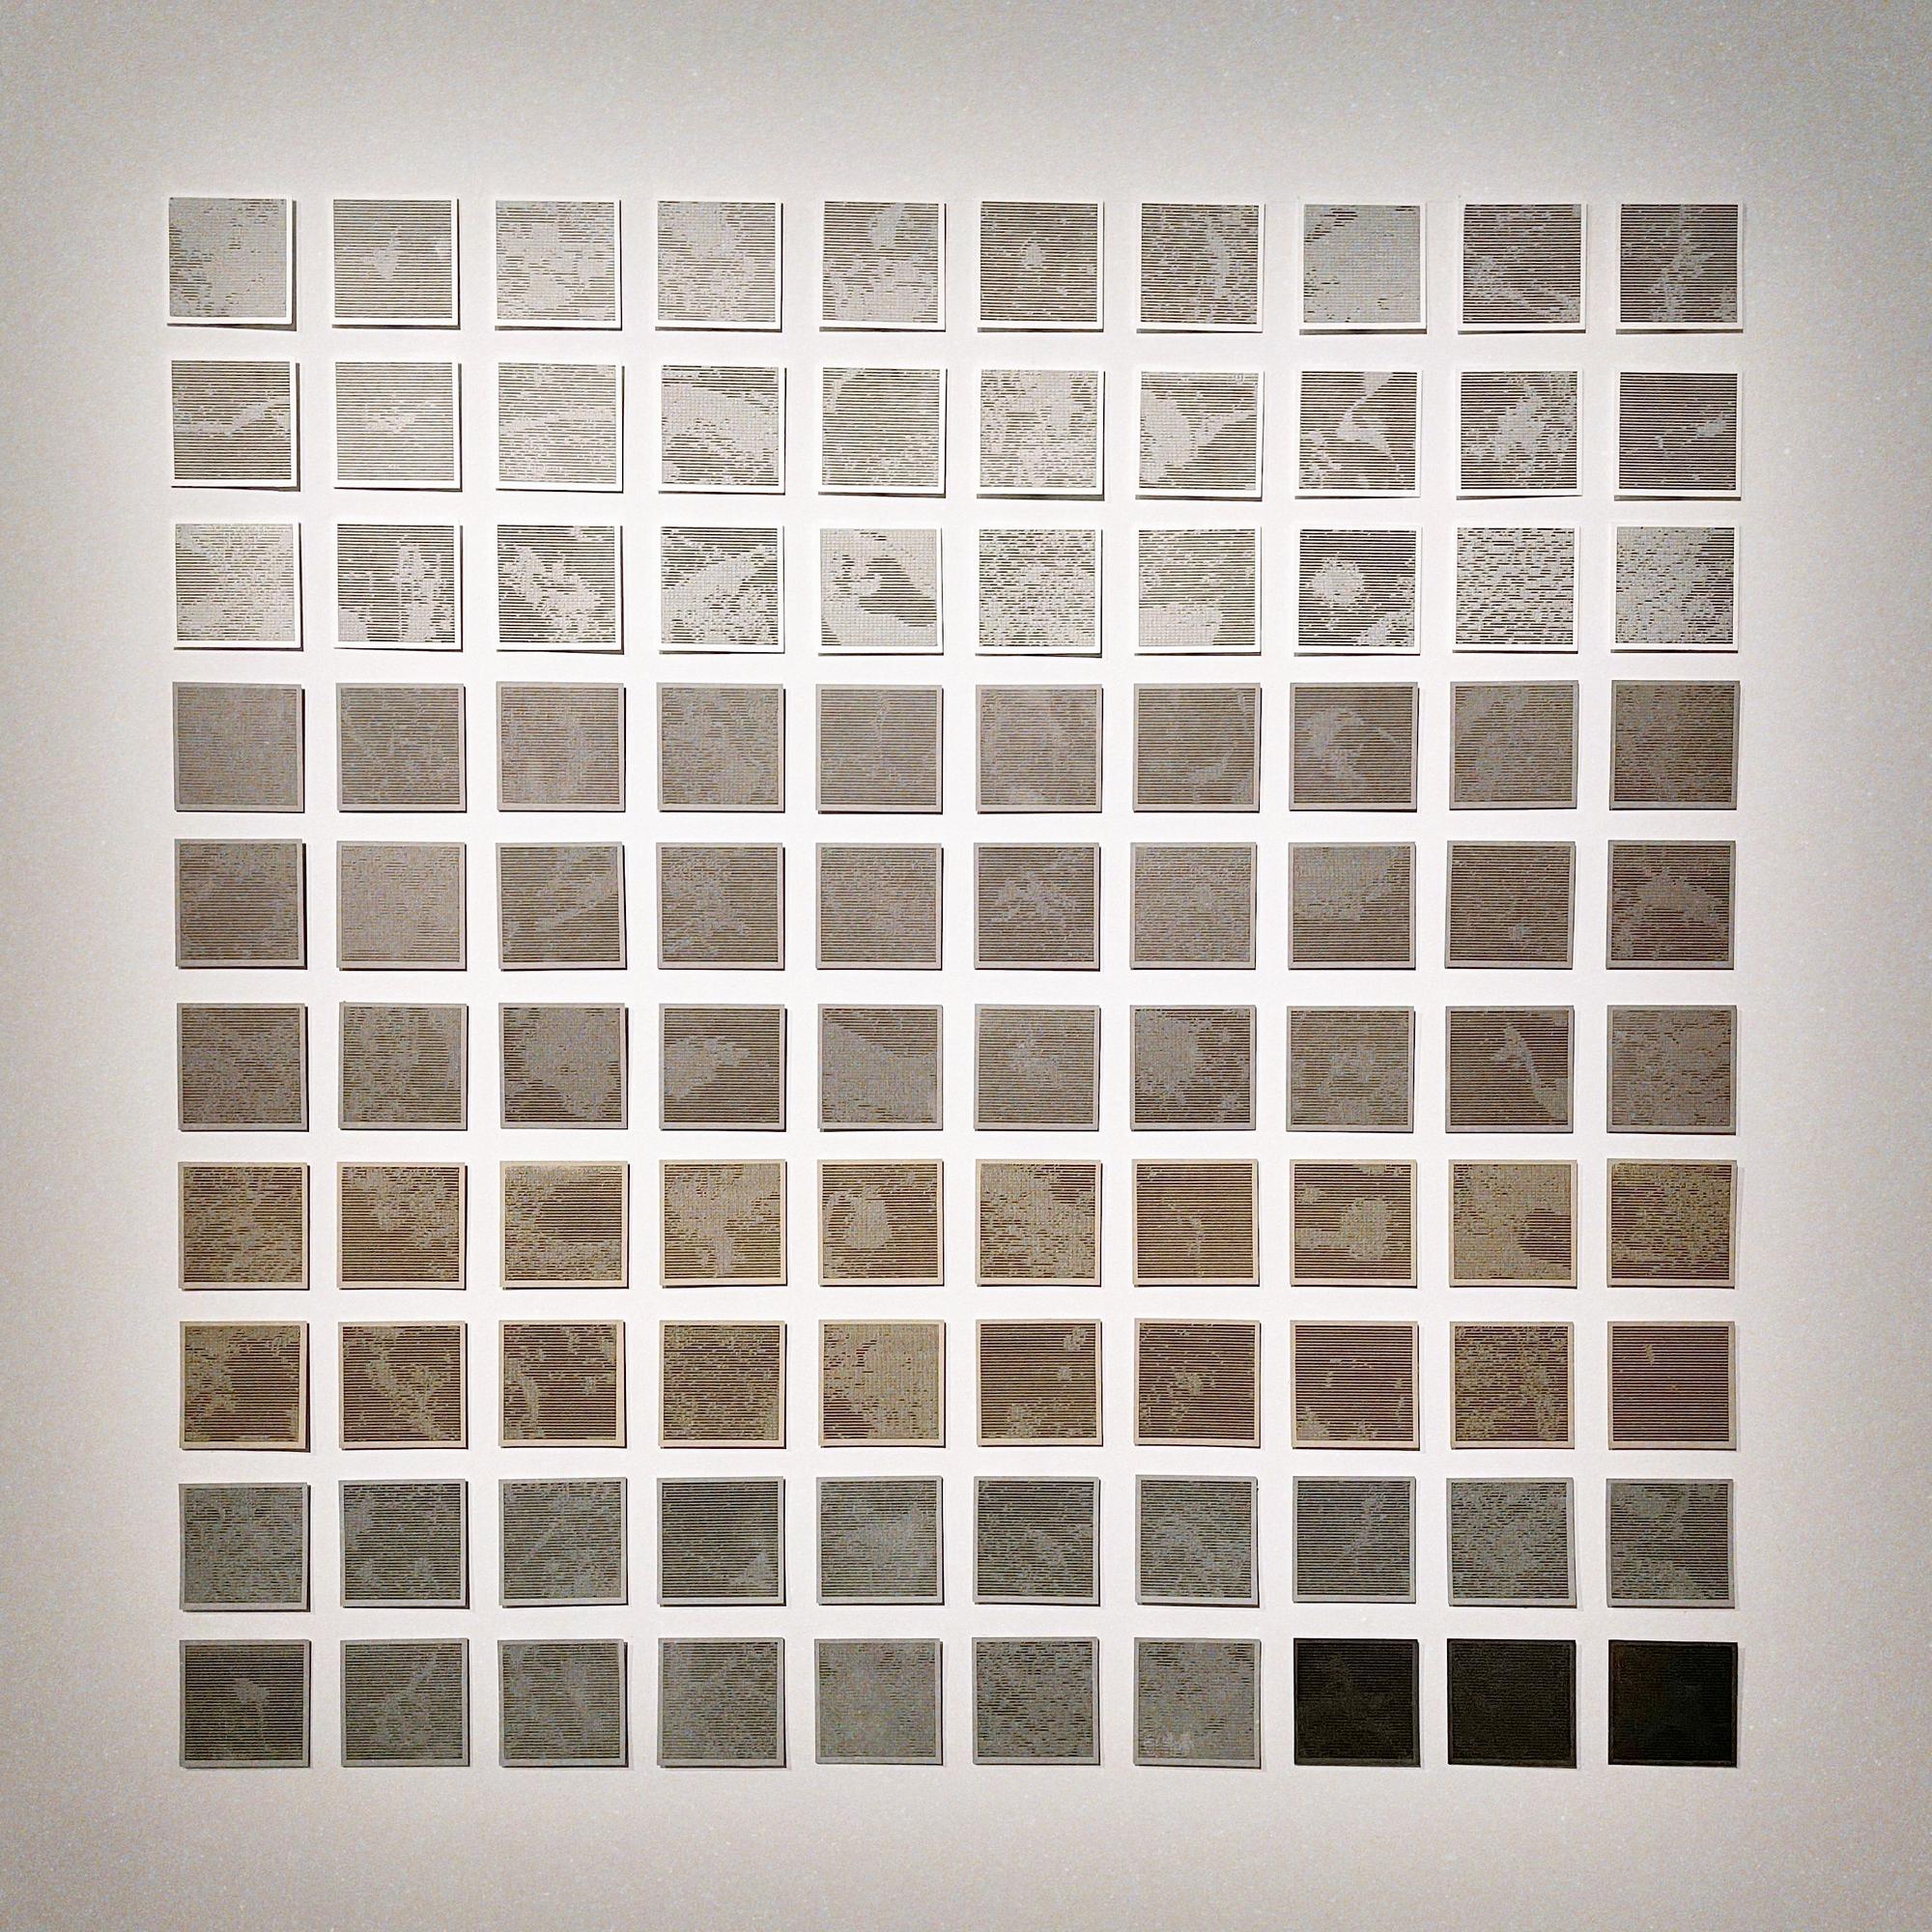
This artwork uses an “AxiDraw” - a mechanical drawing arm, to plot computationally generated graphics onto recycled paper. It uses code - written with openFrameworks - to analyze two images from the same location, taken years or months apart, from NASA's Images of Change1 climate database. The system then outputs graphics made up of a series of 0s and 1s — where the 1s represent the change that occurred in that environment.
0s and 1s are the basic building blocks of computers; they represent the binary that programs fundamentally operate on. Computers are an essential part of climate research and are used to capture, store, and analyze data.
By utilizing the computer's strength of procedural analysis, and replacing images with 0s and 1s, this artwork allows the climate crisis's core element to emerge. The commonality, and reality, that environmental change is happening on a global scale — it needs more than simply banning plastic straws; it requires a global, collective response.
Plotted Ink on Recycled Paper > Hundred 10 x 10 cm Square Grid
Exihibited at the Doha Fire Station, as part of the Artist in Residence Exhibition - Fifth Edition: Grey Times, from the 20.January to 24.June 2021
*each square print represents one percentage of the global greenhouse gas emissions in 2016 - which is around fifty billion tonnes each year. The breakdown is an average percentage from data published by Climate Watch and the World Resources Institute.
**each color represents the average emission percentage from a different global sector:
> the dark grey represents emissions from waste, which include landfills and wastewater;
> the grey represents emissions from transport, which include road, aviation, ship, etc.;
> the light brown represents emissions from agriculture and land use, which include livestock, crop burning, etc.;
> the taupe represents emissions from industry, which include energy emissions, cement, chemicals, etc.;
> the white represents emissions from energy, which include energy in buildings for electricity and heat, and from fuels.
#computation #graphics #exhibition

Details of the Axi-Draw plotting on paper:
Detailed Breakdown of the Code - written with openFrameworks: